In one of my previous articles, I have explained, with example, how to show a floating DIV on each GridView row using JavaScript.
The idea behind showing a floating DIV, next to a GridView row, was to display corresponding details on a separate container, on request. This technique will spare you from displaying every detail in a single row.
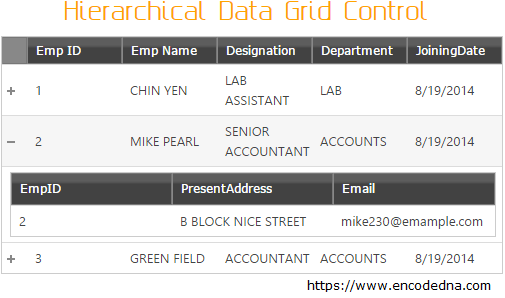
However, Infragistics Hierarchical Data Grid control makes it all look simple. With very little effort, a developer can add the Hierarchical Data Grid on a web page to display corresponding data for each row. It is like adding two Grids, one inside the other like nested Grids, to create a parent-child relationship.
Binding with Hierarchical Data Source
The Asp.Net Hierarchical Data Source control, which comes with the kit, is the ideal control for binding Hierarchical Data Grid (discussed above) with a database table to show data using a parent-child relationship. It is a non-visual Asp.Net control (won’t see it on your web page) that uses various data sources such as SqlDataSource, AccessDataSource etc, to bind the Grid with a database table.
Adding and binding both the controls is relatively simple. Go to the design mode and open the toolbox. Find WebHierarchicalDataGrid and WebHierarchicalDataSource in the toolbox and add it on your web page, one after the other. You now need to configure a data source to the WebHierarchicalDataSource.

Clicking the Configure DataSource, option will open a window and here you will add the first data source (SqlDataSource, for example). The first source will act as the parent. Once done you will see the Add Child option in the same window. Choose the option to select a second data source, which now acts as the child. The second data source is usually another table that you will add to the first table.
Both the tables must have at-least one unique column, which will join the tables or the data source together to a form a relationship. Once you have created the data sources, it is time to bind it with the Hierarchical Data Grid. Click the Data Grid and choose the data source either using the task window or from the property window.
<h2>Bind Hierarchical Data Grid with Hierarchical Data Source</h2>

<ig:WebHierarchicalDataGrid ID="WebHierarchicalDataGrid1"
    DataSourceID="WebHierarchicalDataSource1"
    runat="server" Width="500px" HeaderCaptionCssClass="test" />

<ig:WebHierarchicalDataSource ID="WebHierarchicalDataSource1" runat="server">
    <DataViews>
        <ig:DataView ID="SqlDataSource1_DefaultView" DataMember="DefaultView"
            DataSourceID="SqlDataSource1" />
        <ig:DataView ID="SqlDataSource2_DefaultView" DataMember="DefaultView"
            DataSourceID="SqlDataSource2" />
    </DataViews>
    <DataRelations>
        <ig:DataRelation ChildColumns="EmpID"
            ChildDataViewID="SqlDataSource2_DefaultView" ParentColumns="Emp ID"
            ParentDataViewID="SqlDataSource1_DefaultView" />
    </DataRelations>
</ig:WebHierarchicalDataSource>

<asp:SqlDataSource ID="SqlDataSource2" runat="server"
    ConnectionString="<%$ ConnectionStrings: DNA_CLASSIFIEDConnectionString %>"
    SelectCommand="SELECT [EmpID], [PresentAddress], [Email] FROM dbo.[EmployeeDetails]">
</asp:SqlDataSource>

<asp:SqlDataSource ID="SqlDataSource1" runat="server"
    ConnectionString="<%$ ConnectionStrings: DNA_CLASSIFIEDConnectionString %>"
    SelectCommand="SELECT TOP 3 [EmpID] 'Emp ID', [EmpName] 'Emp Name', [Designation],
        [Department], [JoiningDate] FROM dbo.[Employee]">

</asp:SqlDataSource>
Filtering Options
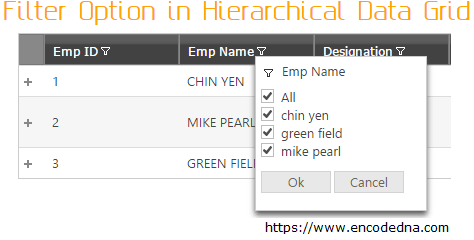
Both the Grids that I have described in this article, has many interesting features. Describing every feature is beyond the scope of this article. However, I personally liked one feature, which I thought would be worth telling. It is the Filtering option in its Behaviors property. It is simple and you do to have to write lengthy codes anymore to add this feature in your project.
<ig:WebHierarchicalDataGrid ID="WebHierarchicalDataGrid1"
    DataSourceID="WebHierarchicalDataSource1"
    runat="server" Width="500px">

    <Behaviors>
        <ig:Filtering FilterType="ExcelStyleFilter"></ig:Filtering>
    </Behaviors>

</ig:WebHierarchicalDataGrid>
It shows an Excel style filtering option on each Header column in the Grid. If you set the FilterType=“ExcelStyleFilter” in the Grid, it will allow users to filter the data in the Grid according to their choice. If you want to give a pleasant experience to your esteemed client or users, then I am sure you do not want to miss this feature.

A good thing about this control is it's simplicity. Trust me, it has many useful functions, which would make a programmers life easy. The in-build wizard is simply great. Anything you want, the wizard will guide you to find it easily.
Furthermore, if you have any queries or suggestions regarding this article, then please leave a message below.
