CloudMonix is a SaaS based application, which provides enhanced monitoring and automation solution for all your resources on Microsoft’s Azure Cloud service. CloudMonix is design by Paraleap Technologies.

It’s an application that every web developer and IT manager must have, if they are serious about their cloud resources. CloudMonix provides a set of useful tools to monitor slowdowns, bad performing SQL queries, memory leaks, website SSL certification expiration etc., which will give you a clear idea on what you require that will help stabilize your cloud applications.
CloudMonix provides a live monitoring dashboard, which will give you minute-by-minute updates on all your resources on Azure. Be it SQL Azure Database, Azure Virtual Machines or Web Apps, you can monitor virtually everything on Azure with precision. You can create and add a dashboard that will display important metrics on Databases, VMs, Web Apps and Azure Websites.
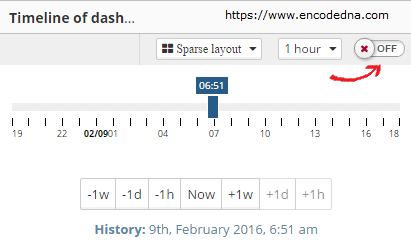
You will never miss a single information as it maintains historical data, which you may view anytime by simply choosing a back date and time. This is an important feature for IT managers who sometimes find it difficult to go through every piece of information every-time and needs historical data for later analysis.
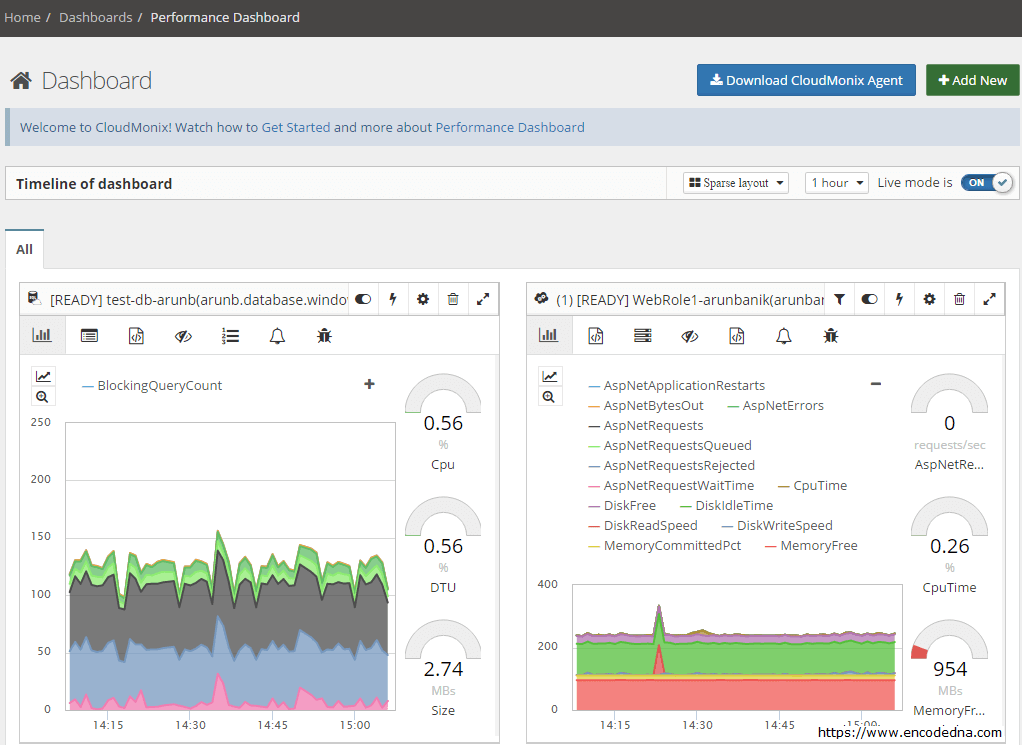
CloudMonix’s unique customizable alert and warning mechanism can help users to find and fix critical issues instantly, without wasting time. You will be in a better position to assess situations and fix the problems before your clients know about it. You can send immediate notifications for alerts to your fellow engineers or IT managers (multiple users) using Email, SMS or using integrated services such as Zendesk, PagerDuty, HipChat etc. You can always share critical data with your team, instantly.
You can set custom alerts against any metrics. For example, you can raise an alert if the memory falls below 100Mbs or the CPU utilization is over 70%, etc.
Name: High CPU
Severity: Warning
Expression: CpuTime30MinAverage > 70
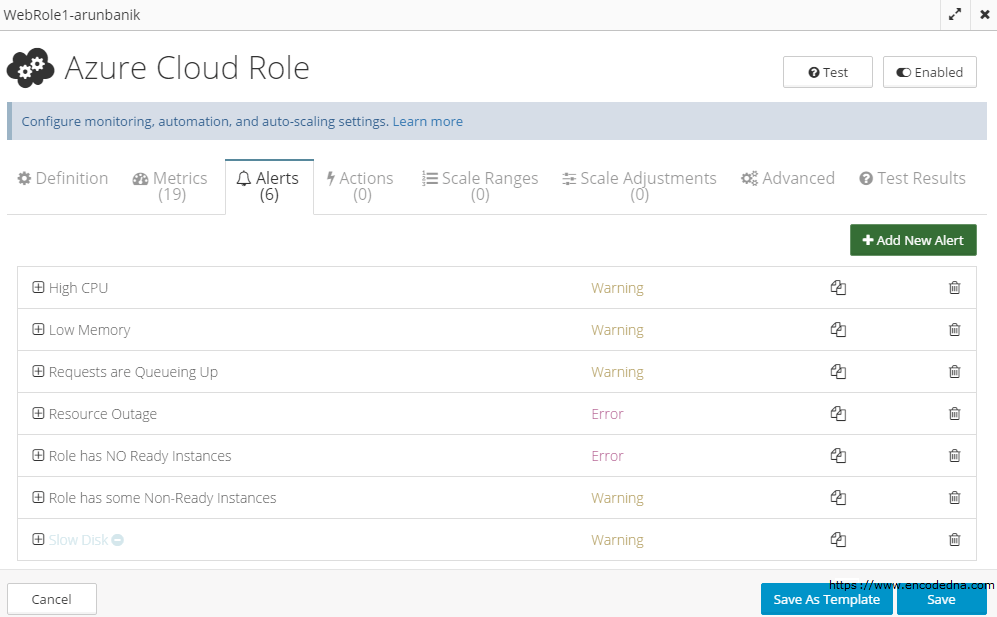
You can never compromise with the stability of any system, especially if it’s hosted on the cloud. If keeping the systems and its services stable is your job, then CloudMonix provides the ultimate tools that would help you maintain the system well. Its automation process is very simple and yet powerful. You can set triggers to automate recovery procedures, self-healing actions, auto scalability etc.
CloudMonix Features
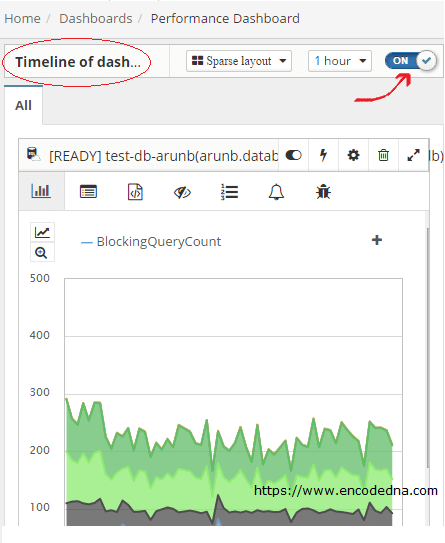
1) It provides a single centralized dashboard to monitor all your Azure resources and systems. The dashboard has a unique feature called the Timeline of Dashboard. Like I said before, it maintains historical data and this unique feature helps the user to go back in time to investigate what actually caused a problem.
For example, Let’s assume you have an SQL database running on Azure. You are monitoring the data using CloudMonix and you get an alert for a problem (You can explicitly set alerts on each resource). To go back in time to investing the process, you simply have to switch the mode of the dashboard from Live On to Live Off.
2) The dashboard shows live graph metrics of each resource individually that will help you track and analyze the performance of various resources. For example, you can track the performance of your Azure SQL database objects, find queries that are running slow or not performing as planned.
This is an important feature from a developer’s point of view. Each developer can define custom SQL metrics to track various SQL objects and queries. In this way, they will be better prepared to handle complex situations in advance.
CloudMonix’s Azure SQL Automation feature allows developers to define custom programs or set pre-defined programs that will show alerts and other useful notifications via its dashboard and reports.
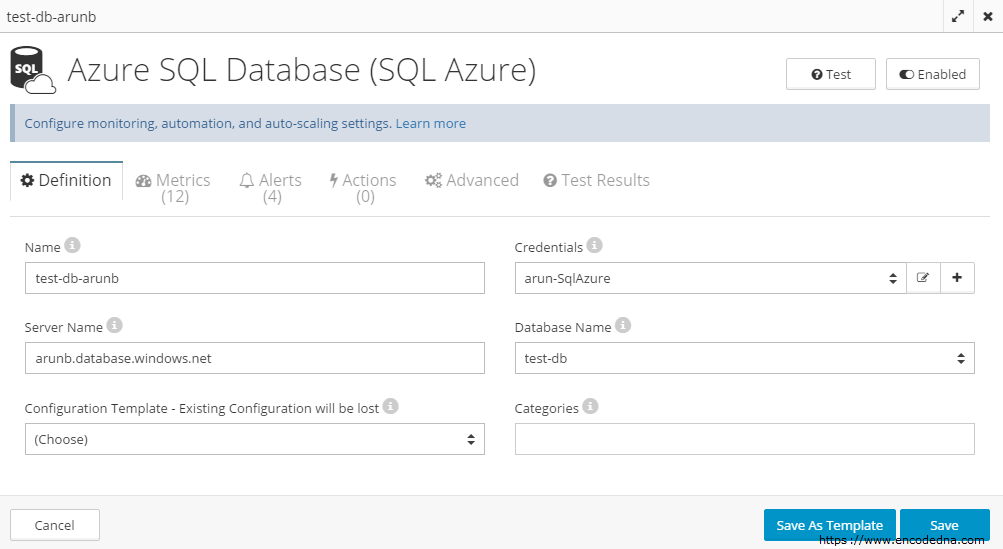
3) You can monitor the health and performance of Windows Servers. We often use Windows Servers for hosting and running websites and other web applications. You can easily setup CloudMonix to monitor a server hosted on the cloud by using its custom monitoring features.
It not only provides an insight of the server’s performance, it also tells you how much resources you have consumed and how much is available. It’s simple automation features allows you to set pre-programmed activities, such as, restart a crashed process and even reboot the whole system when it is low on memory.
4) Reports are vital in any organization to keep track of information. CloudMonix understands the importance of reports and therefore it offers various types of reports to keep track of different activities.
Performance Reports: You can create custom reports to check the Performance of various resources on Azure. Users can create New reports or choose Pre-defined reports to check historical data and use it for analysis.
All you have to do is choose the data and time to start and select any performance metrics and it will automatically create nice graphs (line or area), very similar to a dashboard. You can download the detailed report on your machine in an Image format (PNG, JPG or PDF) or in CSV format.
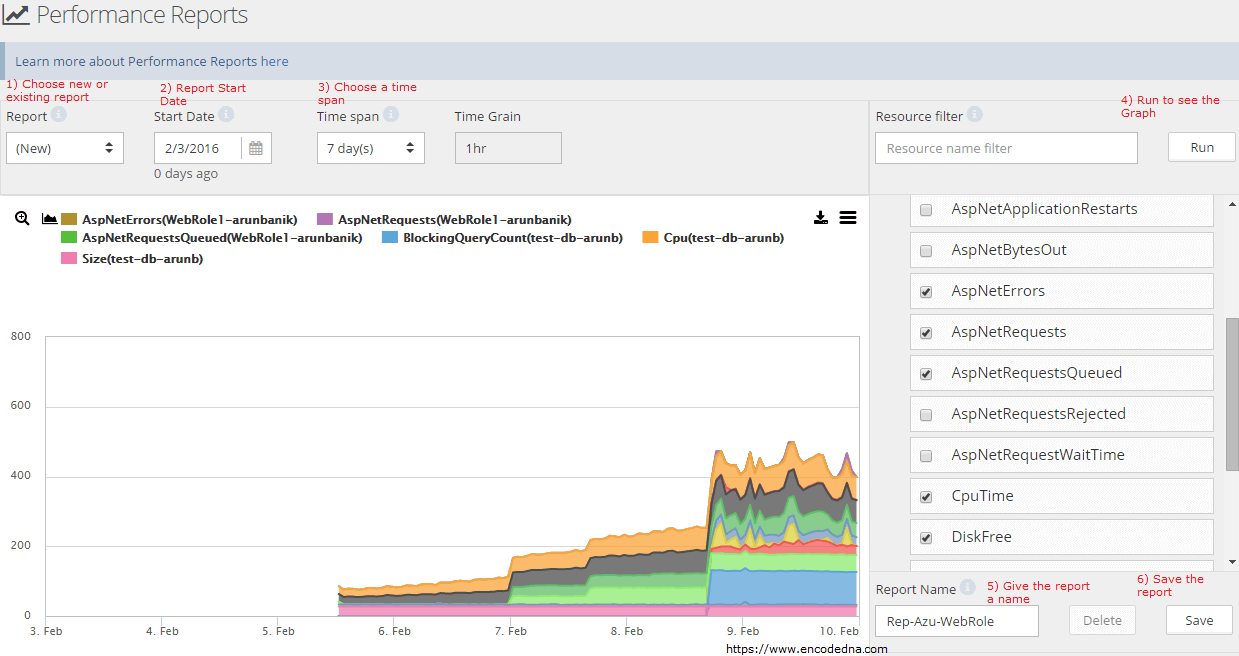
Once you have created a report you can save it for future references.
Uptime Reports: An uptime report shows the percentage of time when a particular resource was Ready within a given time span.
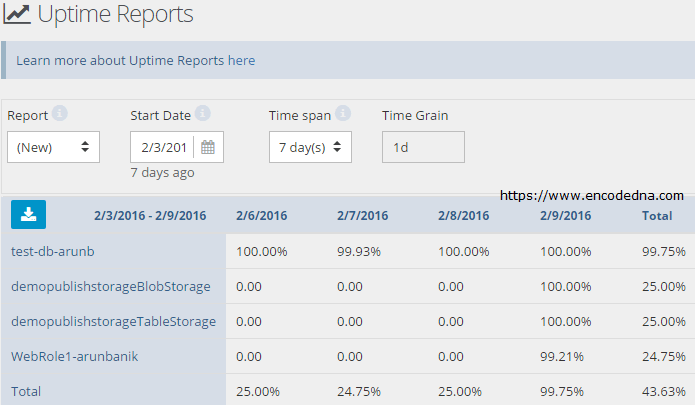
Along with the above-mentioned reports, there are another three different type reports you can create and use. These are Utilization Reports, Alert Reports and Action Reports.
5) Support Features: CloudMonix offers various help and support features. Every module (or page) on the application has a link that will take you to a support page, which explains the module’s functions in detail.
It also has its own Knowledge Base that will greet you a message How can we help you today. The knowledge base also has an FAQ section that has answer to some quick questions.
In case you didn’t find what you were looking in the FAQ or other sections, don’t worry. Every support page has Search Box to the top. You can type your query in it and click the Search button. However, I have found few missing links and information related to Reports. I am sure they will fix it and add information to the missing pages.
Along with the above support features, CloudMonix also has a Forum. Community forums are important place to be, as it not only provides quick solution, its a place share information and knowledge among community members. You can sign up with them (its free) and be a part of the forum. Once you become a member, you can raise issue or questions in the forum. It’s a best place to get quick responses to your queries, along with some expert opinion.
CloudMonix’s Integrations with Third Party Apps
CloudMonix integrates with some of the best third party cloud applications such as, PagerDuty, Zendesk, Slack, HipChat, Twillo and webhooks.
For example, CloudMonix uses Zendesk Cloud application to create support tickets to respond to alerts. It will auto-resolve a ticket when the alert condition is longer active.
Getting Started With CloudMonix
Whatever is your objective, the best way to find out if this application provides you with the solution that you need is to sign up for a free trial. That’s what I did and recommend.
Sign up for a Free 15 days Trail
The Signing up process is very simple. It only requires your Full Name, a valid Email address (for correspondence), a username, password, your Company Name and your Phone Number. You have to provide all this information (its mandatory). It would hardly take 2 minutes max to register.
However, it also provides other simple ways to register, that is, by using accounts like Twitter or using Live (Microsoft) account.
Once you have registered with CloudMonix, they will send you a link to your email address for confirmation. After the confirmation, you are ready to explore CloudMonix’s free features. You can login into CloudMonix.
I would suggest you first create and be ready with a Microsoft Azure Cloud account, along with few cloud services, so that you do not waste time in creating the resource and instead straightaway integrate Azure with CloudMonix.
After you log in, CloudMonix will introduce you to its Setup Wizard screen. The wizard will guide you to setup a connection with your Microsoft Azure account, so it can communicate with all the available resource on the cloud.
This getting started video tutorial is the best way to get a feel of the application and learn basic techniques on how to connect with Azure Cloud resources instantly and start monitoring.
CloudMonix’s Responsive design allows users to use this application anytime, from anywhere, using any kind of device, big or small. I personally like the design of the application. It’s simple navigation features will give you a hassle free experience. I strongly recommend this application for web developers and IT managers who are planning or have already chosen to host their resources on the cloud using Microsoft Azure Cloud Service.
