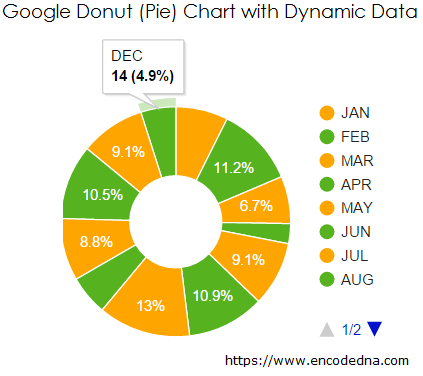
In my previous article, I explained how to implement a Google Pie Chart by extracting data from an SQL Server database using a Web Service. In this example, I’ll take it a step further by creating an ASP.NET Web API to efficiently serve data for the chart.
For seamless data extraction and interaction, I’ll be using jQuery Ajax, ensuring a dynamic and responsive experience.
The SQL Server Table
Let us first create a table in SQL Server. The table has data with monthly sale figures of books (or any commodity) for an entire year.
CREATE TABLE dbo.Books_Annual_Sales(
    Month varchar(20) NULL,
    SalesFigure int NULL
) ON PRIMARY
Now insert few data in the table. The first column is a varchar that will hold values in the form of month and second column is an int that will hold random figures.
INSERT INTO Books_Annual_Sales (Month, SalesFigure) VALUES ('JAN', 34)
INSERT INTO Books_Annual_Sales (Month, SalesFigure) VALUES ('FEB', 22)
...
Similarly, insert more rows into the table to give the chart more values to display.
Let us now create the API that will serve data to the chart.
The Web API (MVC 4)
Remember: You should have MCV 4 installed on your computer. Therefore, please make sure that you have it.
I am assuming you have some knowledge about creating a Web API in Asp.Net. Don’t worry if you are not well versed with it. I have an article for newbie’s, with an extremely simple and yet useful example.
using System;
using System.Collections.Generic;
using System.Linq;
using System.Web;

namespace BooksApp.Models
{
    public class Books
    {
        public string Month { get; set; }
        public int SalesFigure { get; set; }
    }
}
Learn how to add a Model in your Asp.Net Web API project.
Imports System.Web

Namespace BooksApp.Models
    Public Class Books
        Public Property Month() As String
            Get
                Return m_Month
            End Get
            Set(value As String)
                m_Month = value
            End Set
        End Property

        Private m_Month As String

        Public Property SalesFigure() As Integer
            Get
                Return m_SalesFigure
            End Get
            Set(value As Integer)
                m_SalesFigure = value
            End Set
        End Property
        Private m_SalesFigure As Integer
    End Class
End Namespace
Next, create the API Controller.
using System;
using System.Collections.Generic;
using System.Net.http;
using System.Web.http;

using BooksApp.Models;
using System.Data.SqlClient;

namespace BooksApp.Controllers
{
    public class BooksController : ApiController
    {

        List<Books> MySales = new List<Books>();

        public IEnumerable<Books> Get()
        {

            string sConnString = "Data Source=DNA;Persist Security Info=False;" +
                "Initial Catalog=DNA_Classified;User Id=sa;Password=;Connect Timeout=30;";

            SqlConnection myConn = new SqlConnection(sConnString);

            SqlCommand objComm = new SqlCommand("SELECT *FROM dbo.Books_Annual_Sales", myConn);
            myConn.Open();

            SqlDataReader reader = objComm.ExecuteReader();

            // POPULATE THE LIST WITH DATA.
            while (reader.Read())
            {
                MySales.Add(new Books
                {
                    Month = reader["Month"].ToString(),
                    SalesFigure = (int)reader["SalesFigure"]
                });
            }
            myConn.Close();
            return MySales;
        }
    }
}
Option Explicit On

Imports System.Net.http
Imports System.Web.http

Imports System.Data.SqlClient
Imports BooksApp.BooksApp.Models

Namespace BooksApp
    Public Class BooksController
        Inherits ApiController

        Dim mySales As New List(Of Books)()

        Public Function [Get]() As IEnumerable(Of Books)
            Dim sConnString As String = "Data Source=DNA;Persist Security Info=False;" & _
                "Initial Catalog=DNA_Classified;User Id=sa;Password=;Connect Timeout=30;"

            Dim myConn As New SqlConnection(sConnString)

            Dim objComm As New SqlCommand("SELECT *FROM dbo.Books_Annual_Sales", myConn)

            myConn.Open()

            Dim reader As SqlDataReader = objComm.ExecuteReader()

            ' POPULATE THE LIST WITH DATA.
            While reader.Read()
                mySales.Add(New Books() With { _
                    .Month = reader("Month").ToString(), _
                    .SalesFigure = CInt(reader("SalesFigure")) _
                 })
            End While

            myConn.Close()

            Return mySales          ' FINALLY, RETURN THE LIST.

        End Function
    End Class
End Namespace
Well, we have created our Web API and now we need to create a web page (.html page) that will show the data extracted from the API to our Donut chart 🍩.
<!DOCTYPE html>
<html>
<head>
    <title>Google Donut Chart Example with Dynamic Data</title>
    <script src="https://ajax.googleapis.com/ajax/libs/jquery/1.10.2/jquery.min.js"></script>
    <script type="text/javascript" src="https://www.google.com/jsapi"></script>
</head>
<body>
    <div id="b_sale" style="width:500px; height:300px;"></div>
</body>
Inside the <head> tag (in the above markup), I have added the jQuery CDN for Ajax that will get the data from API and the Google API for charts. This API provides the necessary properties and methods to draw the chart.
Inside the <body> tag, I have a DIV element that serves as the container for the chart.
<script>
    // VISUALIZATION API AND THE PIE CHART PACKAGE.
    google.load("visualization", "1", { packages: ["corechart"] });

    google.setOnLoadCallback(DrawDonut);

    function DrawDonut() {
        var options = {
            title: 'MONTHLY SALE OF BOOKS',
            pieHole: 0.4,                       // SET NUMBER BETWEEN 0 AND 1.
            colors: ['orange', '#56B21F']      // ADD CUSTOM COLORS.
        };

        $.ajax({
            url: '/api/books/',
            dataType: "json",
            type: "GET",
            success: function (data) {
                var arrValues = [['Month', 'Sales Figure']];        // DEFINE AN ARRAY.
                var iCnt = 0;

                $.map(data, function () {
                    arrValues.push([data[iCnt].Month, data[iCnt].SalesFigure]);
                    iCnt += 1;
                });

                // CREATE A DataTable AND ADD THE ARRAY (WITH DATA) IN IT.
                var figures = google.visualization.arrayToDataTable(arrValues)

                // THE TYPE OF CHART. IT’S A PIE CHART, HOWEVER THE "pieHole" OPTION
                    // (SEE "var options" ABOVE) WILL ADD A SPACE AT THE CENTER FOR DONUT.
                var chart = new google.visualization.PieChart(document.getElementById('b_sale'));

                chart.draw(figures, options);      // DRAW GRAPH WITH THE DATA AND OPTIONS.
            },
            error: function (XMLHttpRequest, textStatus, errorThrown) {
                alert('There was an Error');
            }
        });
    }
</script>
</html>Remember, you cannot draw a 3D chart for Donut. If you include the is3D option, it will ignore the pieHole option. This option is case sensitive. I have added some custom color for my Donut chart, in the options variable. If you ignore the colors option, the API will add random multiple colors to the chart. Its your choice.
Now, create a Google Pie Chart using data extracted from SQL Server table, Ajax and Asp.Net Web Service.
Make Charts online using our Graph Maker:
From raw JSON data, you can make various charts (or graphs) like pie chart, donut chart, line chart, column chart etc. dynamically using this simple tool.
Turn raw JSON data into meaningful charts.
Try the Graph Maker ➪
