Last updated: 2nd July 2024
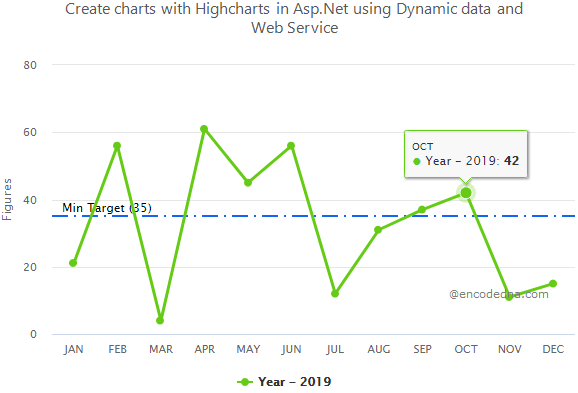
I shared an article on Hightcharts a few days back where I have explained how to create Column charts with Highcharts API dynamically using JSON data extracted from a remote file. You can use any data source for the charts and here I am sharing an example on how to create a basic Line Chart with Hightcharts using data extracted from an SQL Server table by calling an Asp.Net Web Service method using jQuery Ajax.
🚀 Do you know you can converts your raw JSON data into beautiful and meaningful charts? Check this out.
I am assuming, you know SQL Server and you have some knowledge in creating Asp.Net Web Services.
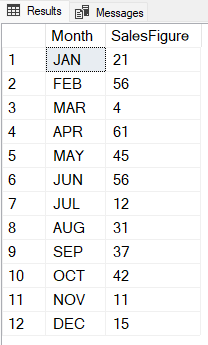
The data for charts will come from an SQL Server table named Books_Annual_Sales. So, let’s create the table first.
CREATE TABLE dbo.Books_Annual_Sales(
    Month varchar(50) NULL,
    SalesFigure int NULL
) ON PRIMARY
Just 2 columns in my table. Add few data to it, like jan, feb, mar etc. for Month and some numeric values for the SalesFigure.

The web service that I am creating for this example, has a public method named Sales_Figures, which will connect to the SQL Server database, get data from the table and finally populate (or fill) data to a List object. The web service will be called using jQuery Ajax POST method.
If you are new to Asp.Net Web service, follow these steps to create a web service in Asp.Net.
1) Create a new Asp.Net project.
2) To add a Web Service in your website, right click the website in the Solution explorer and select Add New Item….
3) From the list of Templates select Web Service and click the Add button.
4) The default name of file will be WebService.asmx (do not change the name), which will be located at the root of your website. This process will also create a Class file with the same name but different extensions. (For C# and Vb.Net)
➡️ Learn more on Asp.Net Web Services.
Ok, let’s get on with the example.
Open WebService.cs (or WebService.vb for Visual Basic programmers). You can find it inside App_Code folder in your project. Write the below code in it.
using System;
using System.Collections.Generic;
using System.Linq;
using System.Web;
using System.Web.Services;
using System.Data.SqlClient;

[System.Web.Script.Services.ScriptService()]
public class WebService : System.Web.Services.WebService
{

    public class Sales_Figures
    {
        public string Month;
        public int SalesFigure;
    }

    [WebMethod]
    public List<Sales_Figures> Annual_Sales()
    {
        List<Sales_Figures> lstSales = new List<Sales_Figures>();

        string sConnString = "Data Source=pc;Persist Security Info=False;" +
            "Initial Catalog=DNA_Clasified;User Id=sa;Password=demo;Connect Timeout=30;";

        SqlConnection myConn = new SqlConnection(sConnString);
        SqlCommand objComm = new SqlCommand("SELECT *FROM dbo.Books_Annual_Sales ", myConn);
        myConn.Open();

        SqlDataReader sdr = objComm.ExecuteReader();

        while (sdr.Read())
        {
            Sales_Figures objValues = new Sales_Figures();
            objValues.Month = sdr["Month"].ToString();
            objValues.SalesFigure = (int)sdr["SalesFigure"];

            lstSales.Add(objValues);
        }

        myConn.Close();
        sdr.Close();
        return lstSales;
    }
}
Imports System.Web
Imports System.Web.Services
Imports System.Web.Services.Protocols

Imports System.Data.SqlClient

<System.Web.Script.Services.ScriptService()> _
Public Class WebService
    Inherits System.Web.Services.WebService

    Public Class Sales_Figures
        Public Month As String
        Public SalesFigure As Integer
    End Class

    <WebMethod()> _
    Public Function Annual_Sales() As List(Of Sales_Figures)
        Dim lstSales As New List(Of Sales_Figures)()

        Dim sConnString As String = "Data Source=pc;Persist Security Info=False;" & _
            "Initial Catalog=DNA_Classified;User Id=sa;Password=demo;Connect Timeout=30;"

        Dim myConn As New SqlConnection(sConnString)
        Dim objComm As New SqlCommand("SELECT *FROM dbo.Books_Annual_Sales ", myConn)
        myConn.Open()

        Dim sdr As SqlDataReader = objComm.ExecuteReader()

        While sdr.Read
            Dim objValues As New Sales_Figures()
            objValues.Month = sdr("Month").ToString()
            objValues.SalesFigure = sdr("SalesFigure")

            lstSales.Add(objValues)
        End While

        myConn.Close() : sdr.Close() : Return lstSales
    End Function
End Class
👉 You can create similar charts using this tool. No programming required.
Also, see this article on how to create a Google Pie Chart using dynamic data and a Web Service.
Now, lets create the chart using Highcharts API by calling the web method.
I am using jQuery Ajax to call the Web Service method. So, I’ll first add a jQuery CDN in my web page followed by the Highcharts CDN.
<head runat="server">
    <script src="http://ajax.googleapis.com/ajax/libs/jquery/1.10.2/jquery.min.js"></script>
    <script src="https://code.highcharts.com/highcharts.js"></script>
</head>
<body>
    <%--The container for the chart.--%>
    <div id="container" style="height: auto; margin: 0 auto;"></div>
</body>
Inside the <body> section, I have a DIV element to show the chart.
<script>
    let createChart = () => {
        $.ajax({
            url: "WebService.asmx/Annual_Sales",
            dataType: "json",
            type: "POST",
            contentType: "application/json; charset=utf-8",
            success: function (data) {
                // Define arrays.
                let arrSales = [];          // array for sales figure.
                let arrCategories = [];     // array for categories.

                let iCnt = 0;               // just a counter.

                $.each(data.d, function () {
                    // populate arrays with values.
                    arrSales.push([data.d[iCnt].SalesFigure]);
                    arrCategories.push([data.d[iCnt].Month])

                    iCnt += 1;
                });

                // Create and show the chart.
                Highcharts.chart('container', {
                    chart: {
                        type: 'line'
                    },
                    xAxis: {		// the 'x' axis or 'category' axis.
                        categories: arrCategories
                    },
                    yAxis: {        // the 'y' axis or 'value' axis.
                        min: 0, max: 80,
                        title: { text: 'Figures' },
                        allowDecimals: true,
                        plotLines: [{
                            value: 35,
                            color: '#1464F4',
                            dashStyle: 'longdashdot',       // default value is solid.
                            width: 2,
                            label: {
                                text: 'Min Target (35)'
                            }
                        }]
                    },
                    title: {
                        text: 'Monthly Sales Chart'
                    },
                    series: [
                        {
                            name: 'Year - 2019',
                            data: arrSales
                        }
                    ],

                    colors: ['rgb(102,203,22)']
                });
            },
            error: function (XMLHttpRequest, textStatus, errorThrown) {
                let error = jQuery.parseJSON(XMLHttpRequest.responseText);
                console.log("Error message: " + error.Message);
            }
        });
    }

    createChart();  // Now, call the function.
</script>
I am calling the Web Service method using jQuery Ajax POST method. Its dataType is JSON. It is easy to convert JSON to an Array and Highcharts take data from an Array.
So far so good
Next, if the call succeeds, I’ll fill the data that the method has received into two arrays.
let arrSales = [];
let arrCategories = [];

$.each(data.d, function () {
…
}Finally, provide the arrays to the chart. The arrSales is for series object and arrCategories for xAxis.
I have used few chart objects and properties in my example. Let me explain.
xAxis Object
The xAxis or the category axis option, shown horizontally, and is where it will show the months. It gets data from an array named arrCategories.
xAxis: {		// the 'x' axis or 'category' axis.
    categories: arrCategories
},
yAxis Object
The yAxis object, also known as the value axis, shows the sales figures in the chart.
yAxis: {    // the 'y' axis or 'value' axis.
    min: 0, max: 80,
    title: { text: 'Figures' },
    allowDecimals: true,
    plotLines: [{
        value: 35,
        color: '#1464F4',
        dashStyle: 'longdashdot',       // default value is solid.
        width: 2,
        label: {
            text: 'Min Target (35)'
        }
    }]
},
The object yAxis has few interesting properties, like the plotlines: []. You can show the threshold or minimum target for sales with the help of a line across the chart (or the graph). See the dashStyle property. Change the value from longdashdot to solid and see how it looks.
The series Object
This is where we provide data to the charts. It has 2 properties: the name of the series and the data for the series.
series: [
    {
        name: 'Year - 2019',
        data: arrSales
    }
]
The remaining objects and properties, I have explained here.
Nice and easy, you can now add some cool and dynamic charts to your website.
