The first example creates a bar chart using static data, which means I’ll define an array of data and labels inside my applications component class. In the second example, again I’ll create a bar chart using dynamic data that is data extracted from an external JSON file
Please follow these steps.
Create the Chart with Static Data using ng2-charts
First, create the Angular project. Get inside the project folder and install Chart.js and ng2-charts using npm.
npm install chart.js –save
followed by
npm install ng2-charts --save
Install both the libraries inside the project, where it will add some files and folders in the “node_modules” folder.
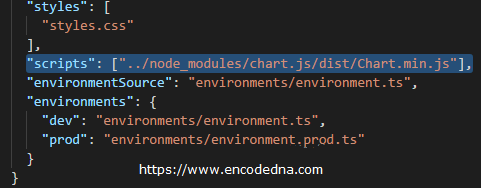
Next, you’ll have to add chart.js to your project. Open .angular-cli.json file (it should be inside the project folder) and add the below script.
"scripts": ["../node_modules/chart.js/dist/Chart.min.js"],
See this image.

It’s like adding a CDN to an HTML page.
Import ChartsModule to the Project
You’ll now have to import the ChartsModule to the app module. Open app.module.ts under src/app/ folder and add the code. See the highlighted part.
import { BrowserModule } from '@angular/platform-browser';
import { NgModule } from '@angular/core';
import { AppComponent } from './app.component';

import { ChartsModule } from 'ng2-charts'

@NgModule({
  declarations: [
    AppComponent
  ],
  imports: [
    BrowserModule,
    ChartsModule
  ],
  providers: [],
  bootstrap: [AppComponent]
})
export class AppModule { }
Next, create the project component.
Create Chart Component
Our chart needs data and we’ll provide this data through our component class. Therefore, open app.component.ts file.
import { Component } from '@angular/core';

@Component({
  selector: 'app-root',
  templateUrl: './app.component.html',
  styleUrls: ['./app.component.css']
})
export class AppComponent {
  title = 'Bar Chart Example in Angular 4';

  // ADD CHART OPTIONS.
  chartOptions = {
    responsive: true    // THIS WILL MAKE THE CHART RESPONSIVE (VISIBLE IN ANY DEVICE).
  }

  labels =  ['JAN', 'FEB', 'MAR', 'APR', 'MAY', 'JUN', 'JUL', 'AUG', 'SEP', 'OCT', 'NOV', 'DEC'];

  // STATIC DATA FOR THE CHART IN JSON FORMAT.
  chartData = [
    {
      label: '1st Year',
      data: [21, 56, 4, 31, 45, 15, 57, 61, 9, 17, 24, 59]
    },
    {
      label: '2nd Year',
      data: [47, 9, 28, 54, 77, 51, 24]
    }
  ];

  // CHART COLOR.
  colors = [
    { // 1st Year.
      backgroundColor: 'rgba(77,83,96,0.2)'
    },
    { // 2nd Year.
      backgroundColor: 'rgba(30, 169, 224, 0.8)'
    }
  ]

  // CHART CLICK EVENT.
  onChartClick(event) {
    console.log(event);
  }
}
👉 Well, you should try the HighCharts API to create simple, interactive and animated charts in Angular 
The Template
ng2-charts are rendered using an HTML <canvas> element. The chart is drawn on a canvas. Therefore, all we need is a <canvas> in our app’s template, along with few attributes to help render the chart.
<h1>
  {{title}}!
</h1>

<div>
  <canvas
      baseChart
      [chartType]="'bar'"
      [datasets]="chartData"
      [labels]="labels"
      [options]="chartOptions"
      [legend]="true"
      [colors]="colors"
      (chartClick)="onChartClick($event)">
  </canvas>
</div>
Properties
• ng2-charts provides a single directive called the baseChart for all types of charts. I have declared the directive in the template with the <canvas>.
• Next, I have defined the chartType as bar. There are six more chart types, which can try. Those are line, radar, pie, doughnut, polarArea and horizontalBar. You can simply change the bar (in the above canvas) to any other chart type.
• datasets – An array of objects that contains an array of data and labels.
Note: Remember, the options are case sensitive.
• labels – An array of labels on the X-Axis. JAN, FEB and MAR etc.
• options – The chart options, provided in the form of an object. I have set a single option for the chart, that is responsive: true (see the component class). This option will ensure that the chart is visible in any devise.
Note: This option may not work property if you have defined a <div> as container to the <canvas> with some width. For example,
<div style="width: 700px;">
    <canvas> …
</div>
• legend – A Boolean true or false to ensure if a legend should be shown above the chart (or not).

• colors – You can define colors to highlight chart data differently. I have an object in my component class named colors with different background for each year’s data.
Event
I have defined a single event to the chart called chartClick, which returns the information regarding active points and labels you have clicked. For example if I click on the tallest bar on the chart, the browser’s console shows me this.

Using Dynamic Data for ng2-charts
You can create dynamic charts with Chart.js by providing or updating the datasets with data extracted from a database or from an External JSON file.
Here’s how the JSON file named sales.json looks like. Save the file in assets folder inside the src folder in your project.
[
    {  "data": [21, 56, 4, 31, 45, 15, 57, 61, 9, 17, 24, 59]  },
    {  "data": [47, 9, 28, 54, 77, 51, 24]  }
]
Only the data (the sales figures), there are no labels. The labels are defined in the component.
I have previously shared an article explaining how to read an external JSON file using HttpClient service in Angular and convert the data to an HTML table. I am using the same method (mentioned in the post) to read and extract data for the Chart in my example here.
First, update the module class by importing HttpClientModule.
import { ChartsModule } from 'ng2-charts'
import { HttpClientModule } from '@angular/common/https';

@NgModule({
  declarations: [
    AppComponent
  ],
  imports: [
    BrowserModule,
    ChartsModule,
    HttpClientModule
  ],
  providers: [],
  bootstrap: [AppComponent]
})Second, update the component class by importing HttpClient and HttpErrorResponse.
import { HttpClient } from '@angular/common/https';
import { HttpErrorResponse } from '@angular/common/https';
The AppComponent class has same objects that I have defined in above example (with static data), except for the chartData object (for the datasets).
To populate the chartData object with dynamic data, I’ll create an empty data and populate the data in ngOnInit() method.
Here’s the updated AppComponent class.
export class AppComponent {

  constructor (private httpService: HttpClient) { }

  labels =  ['JAN', 'FEB', 'MAR', 'APR', 'MAY', 'JUN', 'JUL', 'AUG', 'SEP', 'OCT', 'NOV', 'DEC'];

  // OBJECT FOR datasets WITH EMPTY data.
  chartData = [
    {
      label: '1st Year',
      data: [],
    },
    {
      label: '2nd Year',
      data: []
    }
   ];

   // CHART COLOR.
   colors = [
    { // 1st Year.
      backgroundColor: 'rgba(77,83,96,0.2)'
    },
    { // 2nd Year.
      backgroundColor: 'rgba(30, 169, 224, 0.8)'
    }
   ]

    ngOnInit () {
        this.httpService.get('./assets/sales.json', {responseType: 'json'}).subscribe(
        data => {
            this.chartData = data as any [];	 // FILL THE CHART ARRAY WITH DATA.
        },
        (err: HttpErrorResponse) => {
            console.log (err.message);
        }
        );
    }

  onChartClick(event) {
    console.log(event);
  }
}
The template remains the same.
Well, that's it. Now simply change or add figures in the sales.json file and Angular will automatically update the chart on your browser.
